


Prometheus
Prometheus is an open source, metrics-based monitoring system. It has a simple yet powerful data model and a query language that lets you analyse how your applications and infrastructure are performing.
Prometheus's main features are:
- a multi-dimensional data model with time series data identified by metric name and key/value pairs
- PromQL, a flexible query language to leverage this dimensionality
- no reliance on distributed storage; single server nodes are autonomous
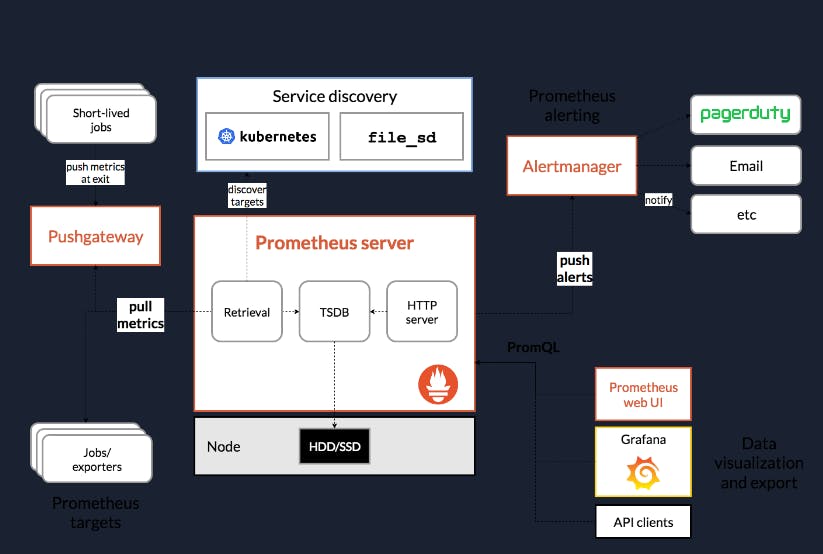
- time series collection happens via a pull model over HTTP
- pushing time series is supported via an intermediary gateway
- targets are discovered via service discovery or static configuration
- multiple modes of graphing and dashboard are supported
What Can You Monitor with Prometheus

Prometheus is a versatile monitoring tool, which you can use to monitor a variety of infrastructure and application metrics. Here are a few common use cases.
Service Metrics Prometheus is typically used to collect numeric metrics from services that run 24/7 and allow metric data to be accessed via HTTP endpoints. This can be done manually or with various client libraries. Prometheus exposes data using a simple format, with a new line for each metric, separated with line feed characters. The file is published on an HTTP server that Prometheus can query and scrape metrics from based on the specified path, port, and hostname. Prometheus can also be used for distributed services, which are run on multiple hosts. Each instance publishes its own metrics and has a name that Prometheus can distinguish.
Host Metrics You can monitor the operating system to identify when a server’s hard disk is full or if a server operates constantly at 100% CPU. You can install a special exporter on the host to collect the operating system information and publish it to an HTTP-reachable location.
Website Uptime/Up Status Prometheus doesn’t usually monitor website status, but you can use a blackbox exporter to enable this. You specify the target URL to query an endpoint, and perform an uptime check to receive information such as the website’s response time. You define the hosts to be queried in the prometheus.yml configuration file, using relabel_configs to ensure Prometheus uses the blackbox exporter.
How Does Prometheus Monitoring Work

To get metrics, Prometheus requires an exposed HTTP endpoint. Once an endpoint is available, Prometheus can start scraping numerical data, capture it as a time series, and store it in a local database suited to time-series data. Prometheus can also be integrated with remote storage repositories.
Users can leverage queries to create temporary times series from the source. These series are defined by metric names and labels. Queries are written in PromQL, a unique language that allows users to choose and aggregate time-series data in real time. PromQL can also help you establish alert conditions, resulting in notifications to external systems like email, Slack.
Why Use Prometheus for Kubernetes Monitoring

Prometheus is a common choice for Kubernetes monitoring, because it was built for a cloud-native environment. Here are several key benefits of using Prometheus to monitor Kubernetes workloads:
- Multidimensional data model – The use of key-value pairs creates a similarity to how Kubernetes uses labels to organize infrastructure metadata. This similarity ensures time-series data can be collected and analyzed accurately by Prometheus.
- Accessible format and protocols – Prometheus enables easy and simple exposure of metrics. It ensures metrics are human-readable and can be published via standard HTTP transport.
- Service discovery – Prometheus server periodically scrapes targets. Services and applications do not have to ---- constantly emit data—metrics are pulled, instead of pushed. Prometheus servers can employ several techniques to auto-discover scrape targets. You can, for example, configure the servers to filter and match container metadata.
- Modular and highly available components – Composable services are responsible for performing metric collection, graphical visualization, alerting, and more. Each of these services support sharding and redundancy.
Installation

- Using Docker
All Prometheus services are available as Docker images on Quay.io or Docker Hub. Running Prometheus on Docker is as simple as docker run -p 9090:9090 prom/prometheus. This starts Prometheus with a sample configuration and exposes it on port 9090.
The Prometheus image uses a volume to store the actual metrics. For production deployments it is highly recommended to use a named volume to ease managing the data on Prometheus upgrades.
There are lots of ways you can manage your own configure but here I mention two methods
- Volumes & bind-mount
Bind-mount your prometheus.yml from the host by running:
docker run \
    -p 9090:9090 \
    -v /path/to/prometheus.yml:/etc/prometheus/prometheus.yml \
    prom/prometheus
Or bind-mount the directory containing prometheus.yml onto /etc/prometheus by running:
docker run \
    -p 9090:9090 \
    -v /path/to/config:/etc/prometheus \
    prom/prometheus
Custom image To avoid managing a file on the host and bind-mount it, the configuration can be baked into the image. This works well if the configuration itself is rather static and the same across all environments.
For this, create a new directory with a Prometheus configuration and a Dockerfile like this:
FROM prom/prometheus
ADD prometheus.yml /etc/prometheus/
Now build and run it:
docker build -t my-prometheus .
docker run -p 9090:9090 my-prometheus
A more advanced option is to render the configuration dynamically on start with some tooling or even have a daemon update it periodically.
What are metrics?
In layperson terms, metrics are numeric measurements. Time series means that changes are recorded over time. What users want to measure differs from application to application. For a web server it might be request times, for a database it might be number of active connections or number of active queries etc.
Metrics play an important role in understanding why your application is working in a certain way. Let's assume you are running a web application and find that the application is slow. You will need some information to find out what is happening with your application. For example the application can become slow when the number of requests are high. If you have the request count metric you can spot the reason and increase the number of servers to handle the load.
Querying Prometheus
Prometheus provides a functional query language called PromQL (Prometheus Query Language) that lets the user select and aggregate time series data in real time. The result of an expression can either be shown as a graph, viewed as tabular data in Prometheus's expression browser, or consumed by external systems via the HTTP API.
This example selects only those time series with the http_requests_total metric name that also have the job label set to prometheus and their group label set to canary:
http_requests_total{job="prometheus",group="canary"}
Alerting
Knowing when things are going wrong is usually the most important function of monitoring is to advise you when things are going wrong. You want the monitoring system to call in a human to take a look.
Alerting with Prometheus is separated into two parts:
Alerting rules in Prometheus servers send alerts to an Alertmanager.
The Alertmanager then manages those alerts, including silencing, inhibition, aggregation and sending out notifications via methods such as email, on-call notification systems, and chat platforms.
Recording Rules and Alerts
Recording rules allow PromQL expressions to be evaluated on a regular basis and their results ingested into the storage engine.
Alerting rules are another form of recording rules. They also evaluate PromQL expressions regularly, and any results from those expressions become alerts. Alerts are sent to the Alertmanager.
Grafana
Grafana is an open-source tool used to create dashboards for monitoring. It is in widespread use and thus an industry standard It allows you to query, visualize, alert on and understand your metrics. It allows you to create, explore, and share beautiful dashboards with your team.
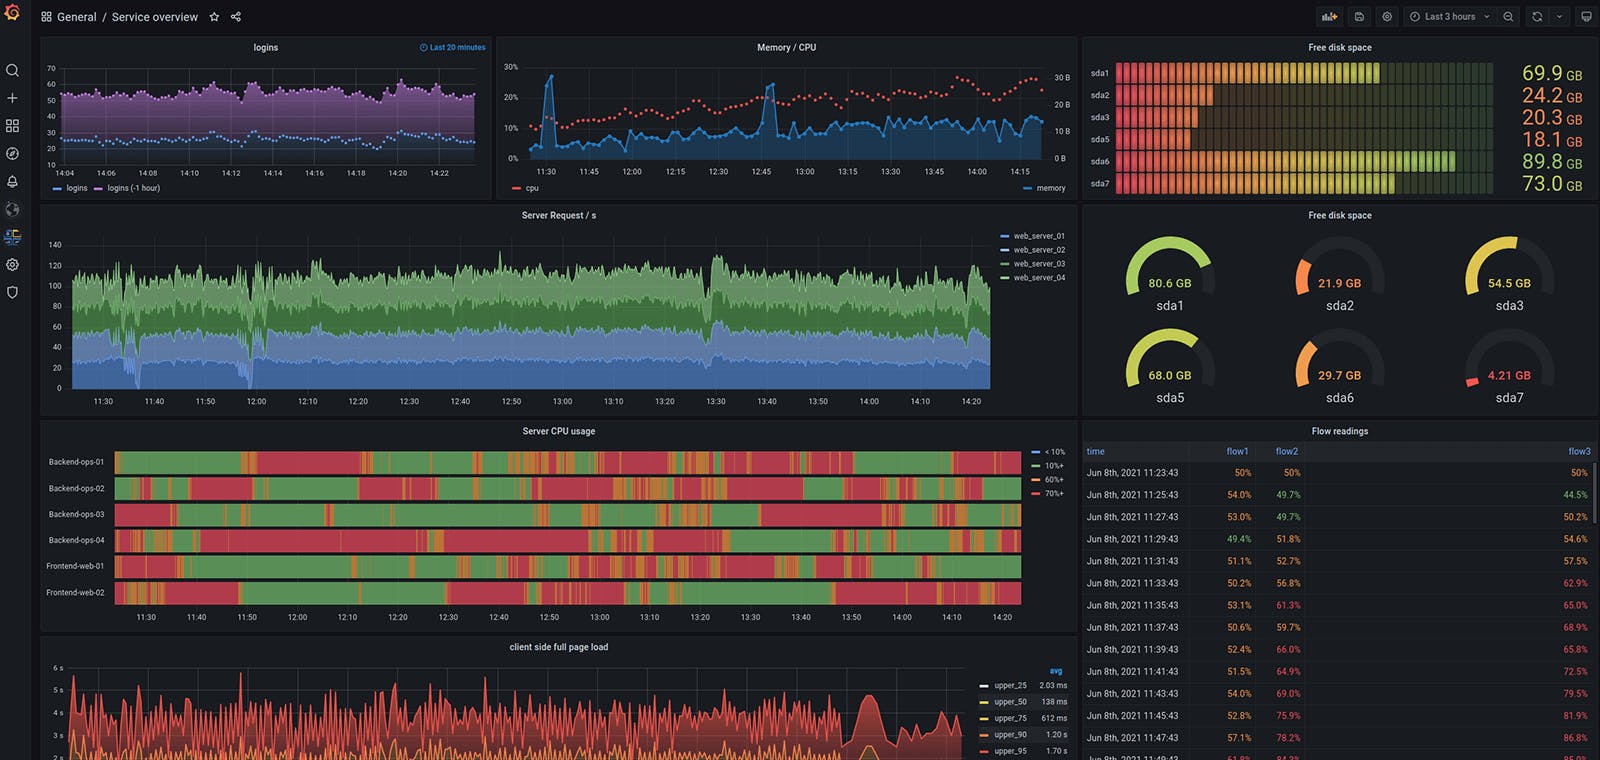
Grafana Dashboards
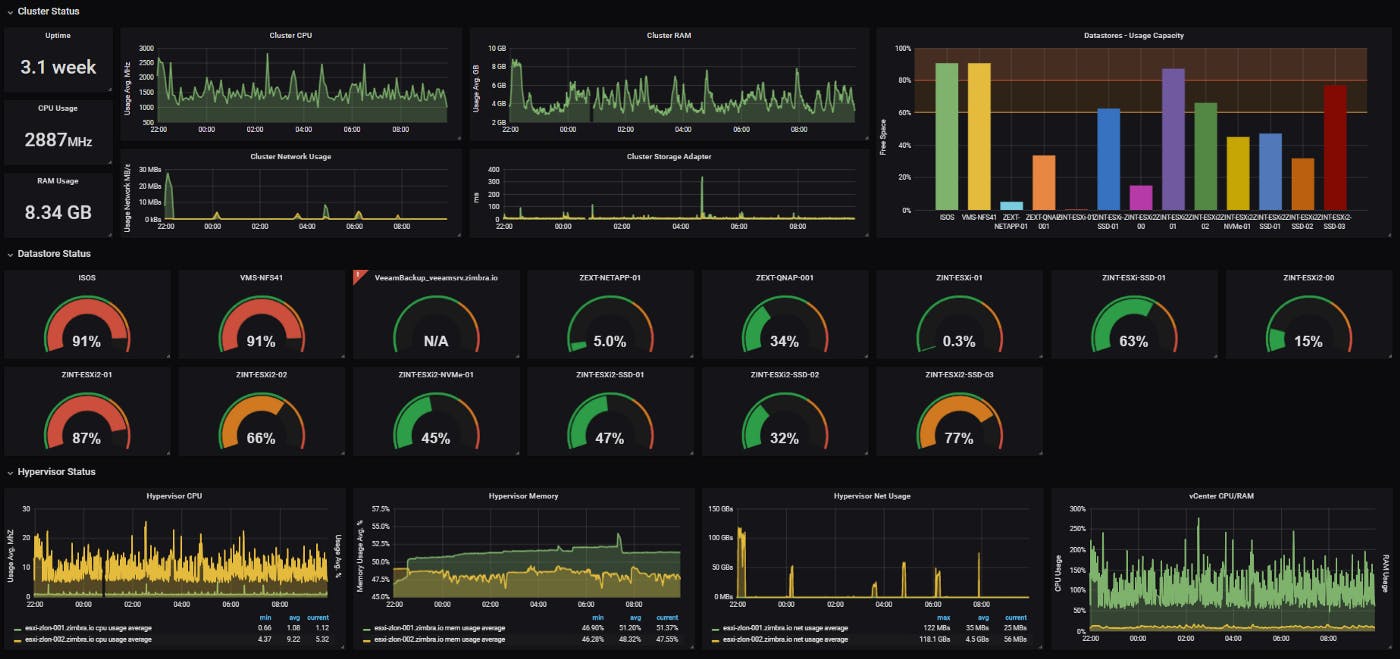
A dashboard is a set of one or more panels organized and arranged into one or more rows. Grafana ships with a variety of panels making it easy to construct the right queries, and customize the visualization so that you can create the perfect dashboard for your needs. Each panel can interact with data from any configured Grafana data source.
Resources
🚩 prometheus.io/docs/introduction/overview
🚩 prometheus.io/docs/tutorials/getting_started
That's all for this blog, I hope you will learn something new. And feel free to share your thoughts and feedback, Thanks for reading.
Feel free to reach out me 👀
Twitter 🖱
LinkedIn 🖱
Github 🖱