Automate Kubernetes Troubleshooting with Komodor

Hi, i am a post graduate (MCA) student and a open source contributor.
1. Introduction to kumodor
Komodor is basically a open source platform. In simple terms it is a kubernetes(k8s) troubleshoot tool that make easy to our day to day life in case of kubernetes cluster and stuffs, for both local and cloud cluster. Suppose your running container are being stopped, cluster breakdown, or stuck some where else by changing somewhat and now lots of issues are arise and it's really going something wrong, in this condition komodor can help you.
2. What is kubernetes troubleshooting
AS kubernetes is a container orchestration management platform so it is sometime all the task does not really work as expected line application crashes, does't load or deploy, there are lots of failure scenarios. In simple terms when the task are not really work as expected until & unless you are gonna fixed the issue and make the system normal.
There are lots of aspects that make more effective when we working with kubernetes, not only that there are lots of factors in case of kubernetes troubleshooting incident management.
Understanding
- In a Kubernetes environment, it can be very difficult to understand what happened and determine the root cause of the problem. This typically involves:
- Reviewing recent changes to the affected cluster, pod, or node, to see what caused the failure. -Analyzing YAML configurations, Github repositories, and logs for VMs or bare metal machines running the malfunctioning components. -Looking at Kubernetes events and metrics such as disk pressure, memory pressure, and utilization. In a mature environment, you should have access to dashboards that show important metrics for clusters, nodes, pods, and containers over time.
Management
In a microservices architecture, it is common for each component to be developed and managed by a separate team. Because production incidents often involve multiple components, collaboration is essential to remediate problems fast.
Prevention
Successful teams make prevention their top priority. Over time, this will reduce the time invested in identifying and troubleshooting new issues. Preventing production issues in Kubernetes involves:
- Creating policies, rules, and playbooks after every incident to ensure effective remediation
- Investigating if a response to the issue can be automated, and how
- Defining how to identify the issue quickly next time around and make the relevant data available—for example by instrumenting the relevant components
- Ensuring the issue is escalated to the appropriate teams and those teams can communicate effectively to resolve it
3. Challenges faced during troubleshooting
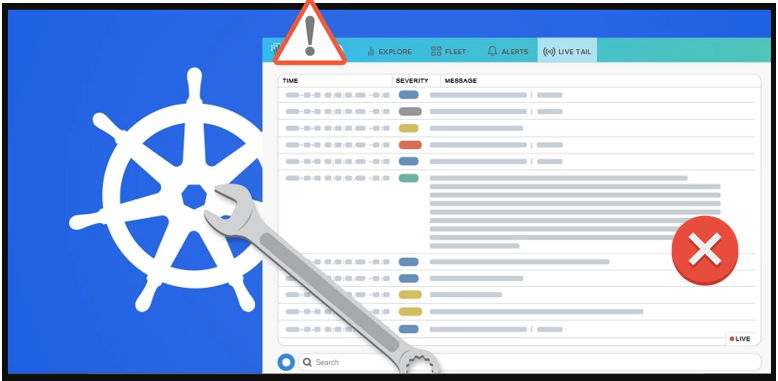
Kubernetes is a complex system, and troubleshooting issues that occur somewhere in a Kubernetes cluster is just as complicated.
Even in a small, local Kubernetes cluster, it can be difficult to diagnose and resolve issues, because an issue can represent a problem in an individual container, in one or more pods, in a controller, a control plane component, or more than one of these.
In a large-scale production environment, these issues are exacerbated, due to the low level of visibility and a large number of moving parts. Teams must use multiple tools to gather the data required for troubleshooting and may have to use additional tools to diagnose issues they detect and resolve them.
To make matters worse, Kubernetes is often used to build microservices applications, in which each microservice is developed by a separate team. In other cases, there are DevOps and application development teams collaborating on the same Kubernetes cluster. This creates a lack of clarity about division of responsibility – if there is a problem with a pod, is that a DevOps problem, or something to be resolved by the relevant application team?
In short – Kubernetes troubleshooting can quickly become a mess, waste major resources and impact users and application functionality – unless teams closely coordinate and have the right tools available.
4. Why this tool useful for troubleshooting
Easy to use as it's friendly UI
Simplly install to your local and cloud cluster
It can easiliy monotor to your running cluster that what and where the entire changes is done and what's the effect is.
The most important founctionality of this platform, you can easily revert the changes so that the cluster back again to it's previous state.
Cost and Consumption Optimization
Third-party Integrations
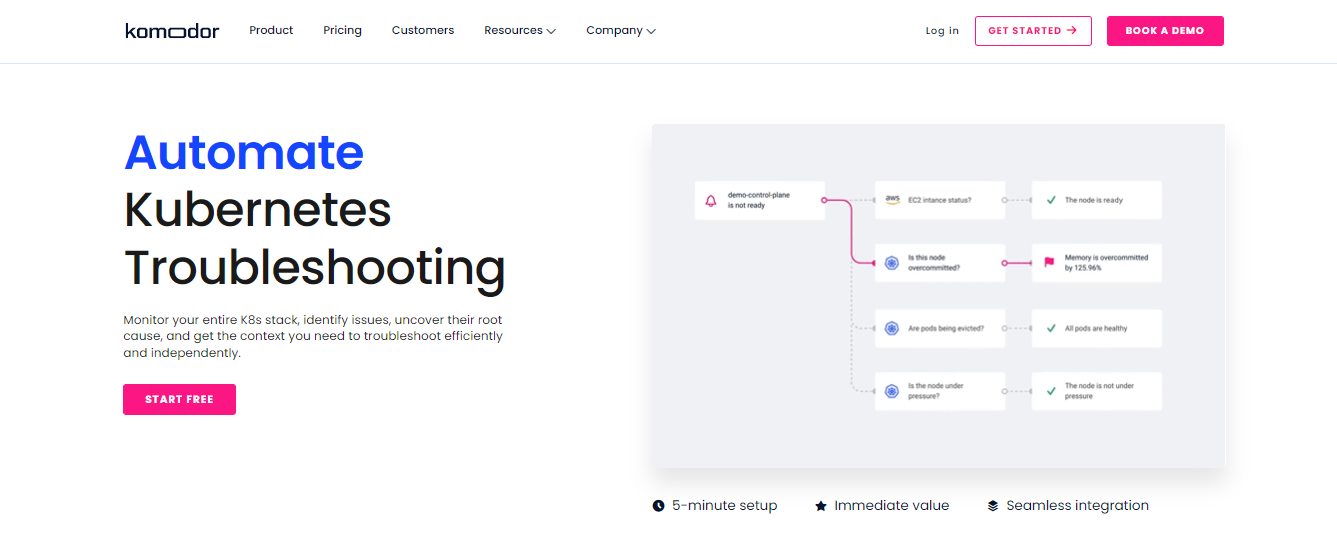
5. How it works
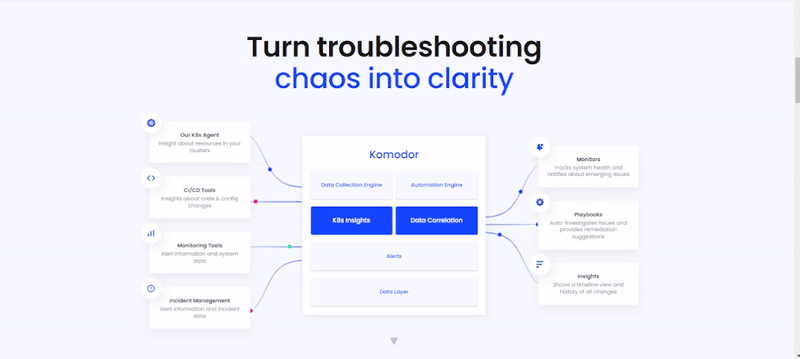
It's a kubernetes troubleshooting platform that automate kubernetes troubleshooting. We can also monitor our entire kubernetes stack that identifies issue and figure out the root cause was. The idea behind this tool is that basically it can take inside from your cluster so we can install komodor in our cluster, in both local and cloud cluster. In simple words it can monitor your entire cluster what, where and who made change in a particular running cluster and what effect by that change, komodor can easy automate this things. Not only that komodor can easily rollback the changes so that the cluster get into previous as it is state. Also komodor take responsibility about resources, logs and all this other things.
6. Installation & Configuration
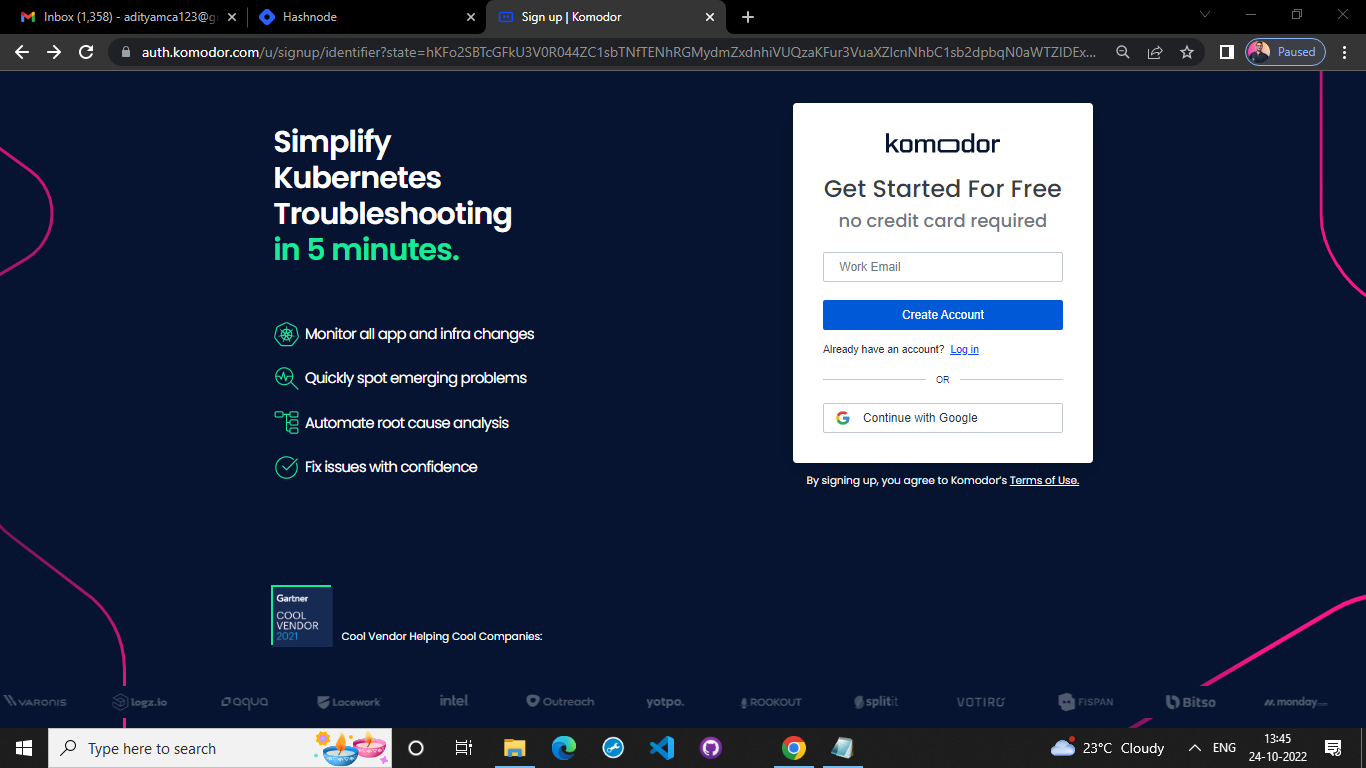
Signing with email at komodor
After signin you have to enter a cluster name
And finally you need to copy following helm command that install komodor's agent on your cluster. And paste to your cloud terminal. In this way we basically intergrate our kubernates cluater with komodor k8s watcher.
After then when all the installation being completed a nice friendly UI will represent in your screen. This is basically collection of all the application that deployed on your kubernetes cluster. Here you can monitor things in real time.
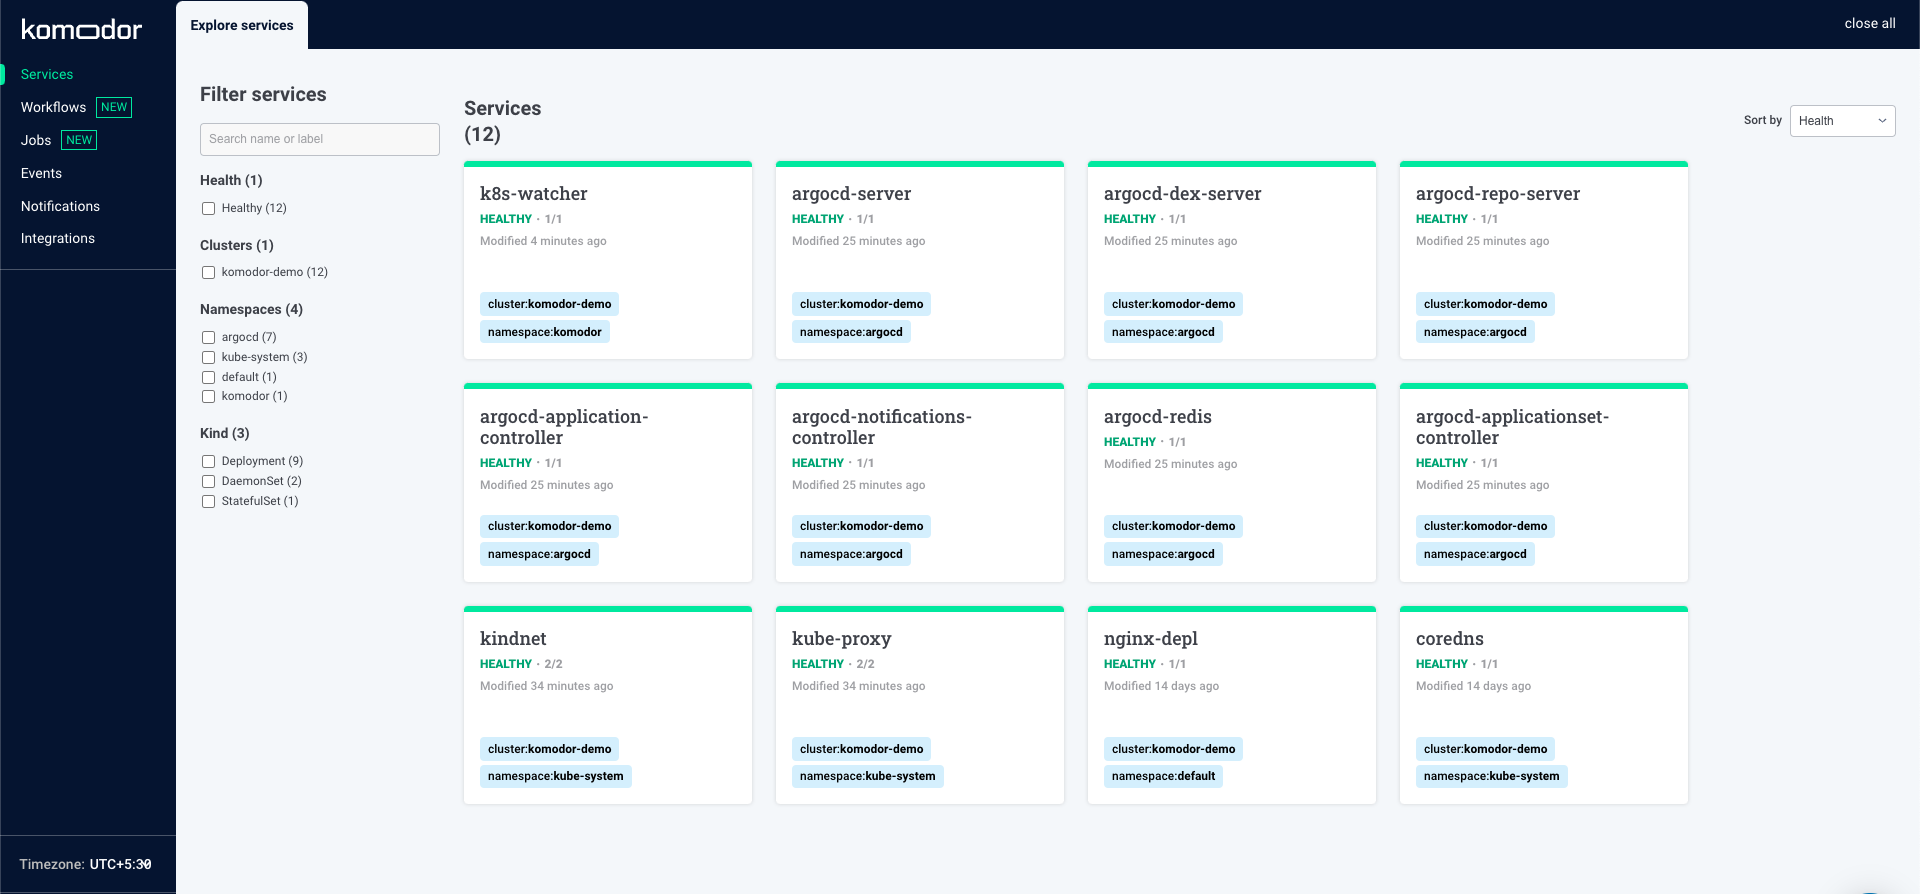
The user interface of the tool is quite intuitive, simple, and self-explanatory. Major sections of the tools are arranged under a list of tabs, including services, jobs, events, alerts, and more. The events page carries a lot of information about the various events occurring in your clusters but organizes it well to avoid visual noise.
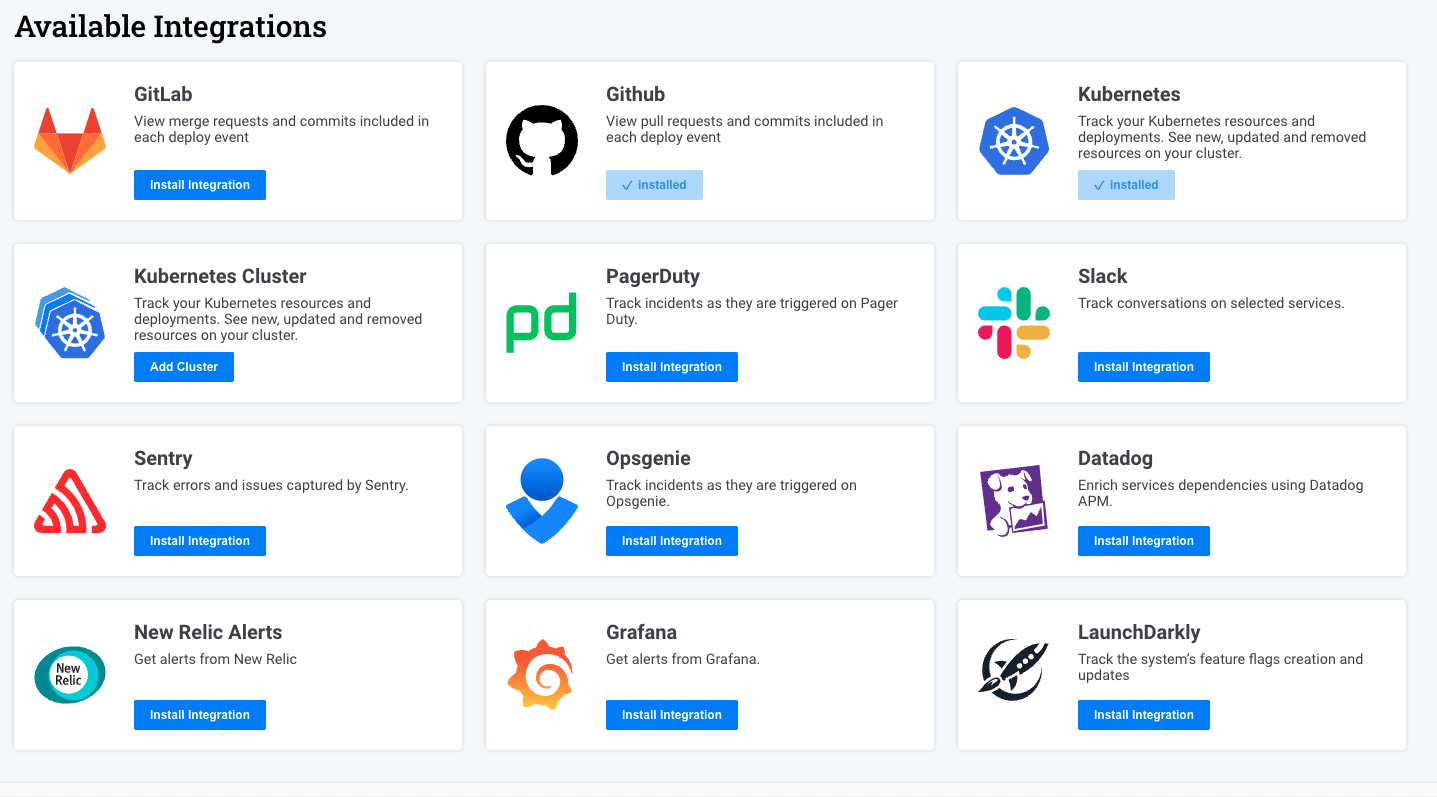
The integrations and notifications section both concisely list out the relevant data making it easy for you to get started as well as view old data easily.
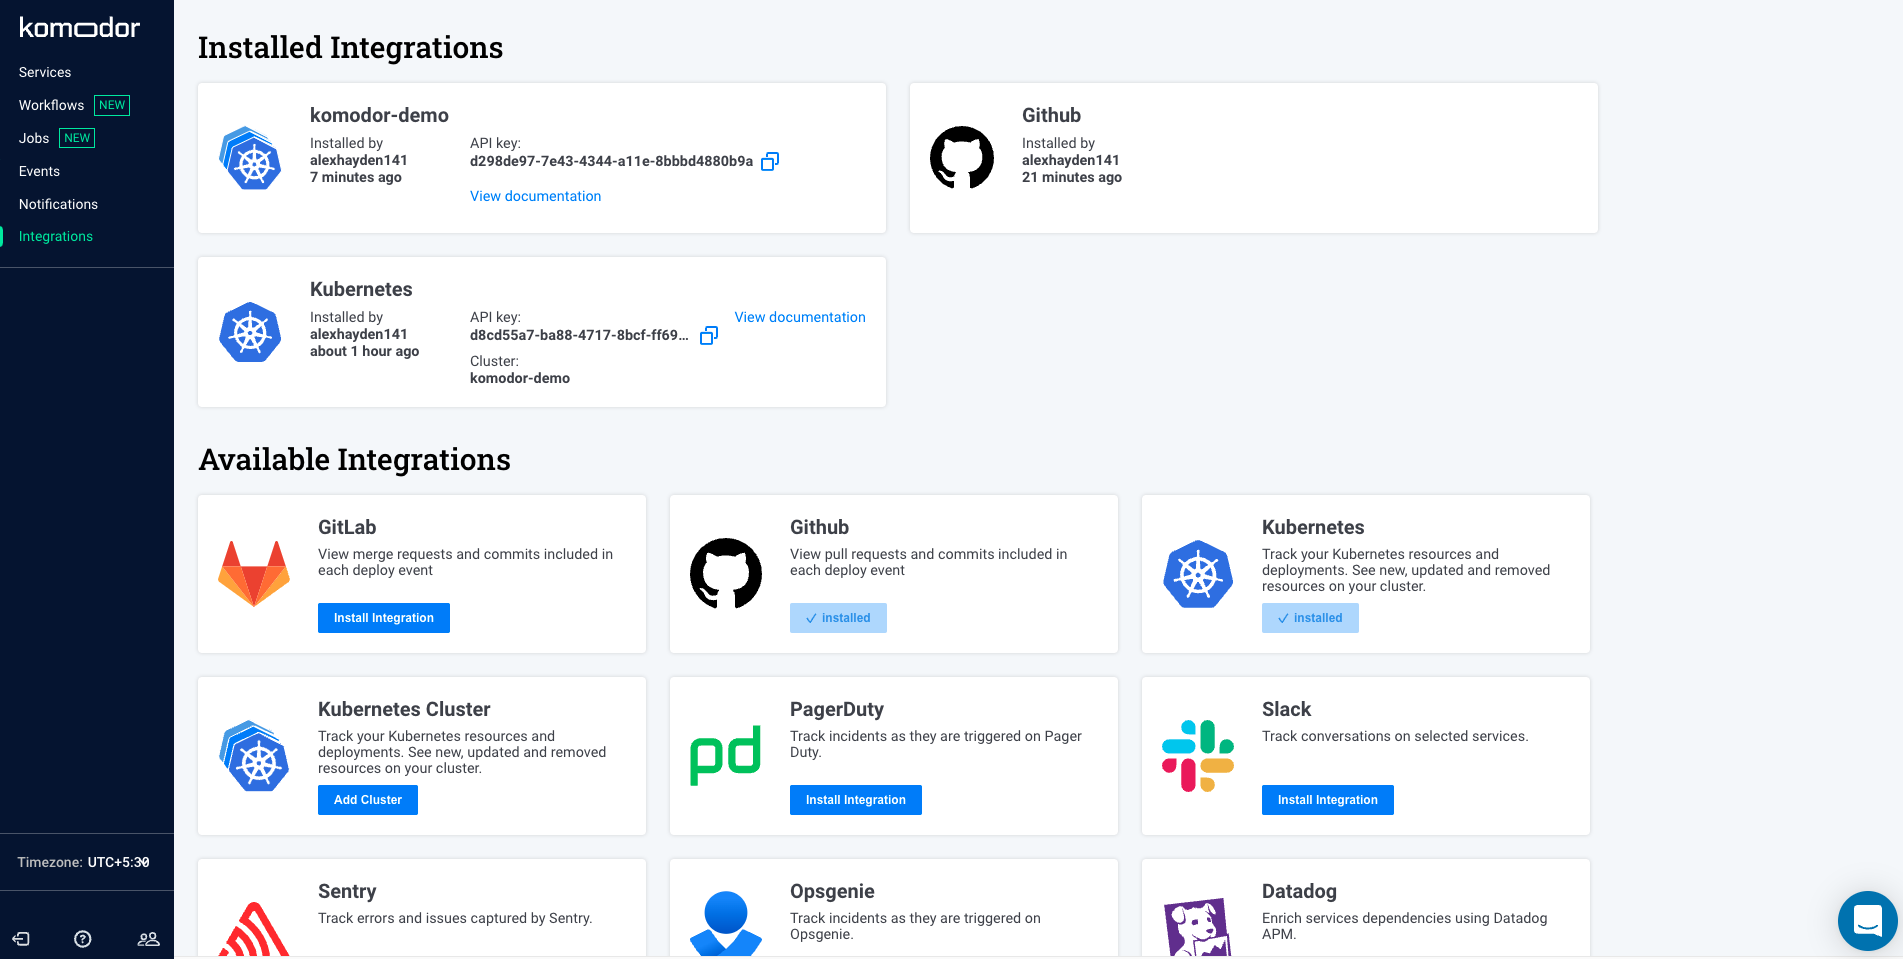
Komodor offers a limited range of third-party integrations to help make your life easier. You can easily set up your Kubernetes cluster, link its repo, and connect to a Slack channel for sending out event-related alerts. You can also connect with other tools like Sentry, OpsGenie, DataDog, etc., for incident management.
This will be the most important things because all the information related to event time line is present here.
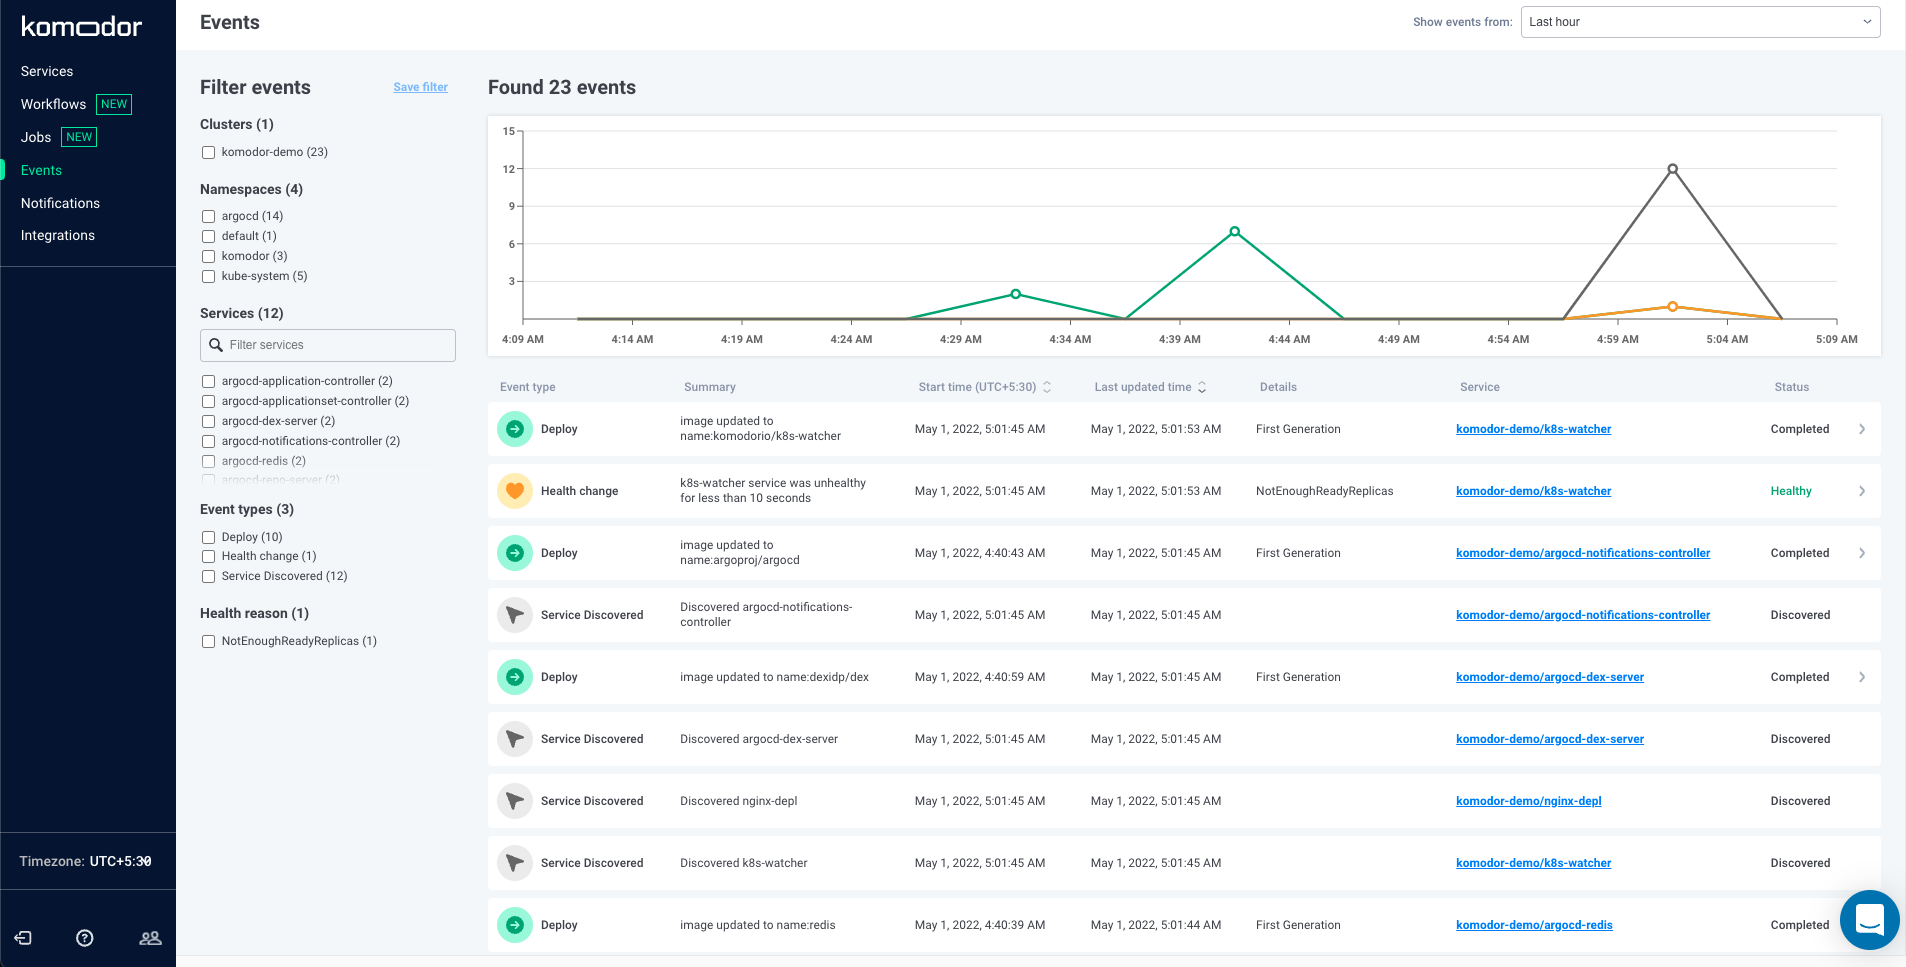
Komodor tracks all events that occur in your Kubernetes clusters and stacks them against time to show you a histogram of what’s been happening with your clusters. The events are quite detailed in themselves.
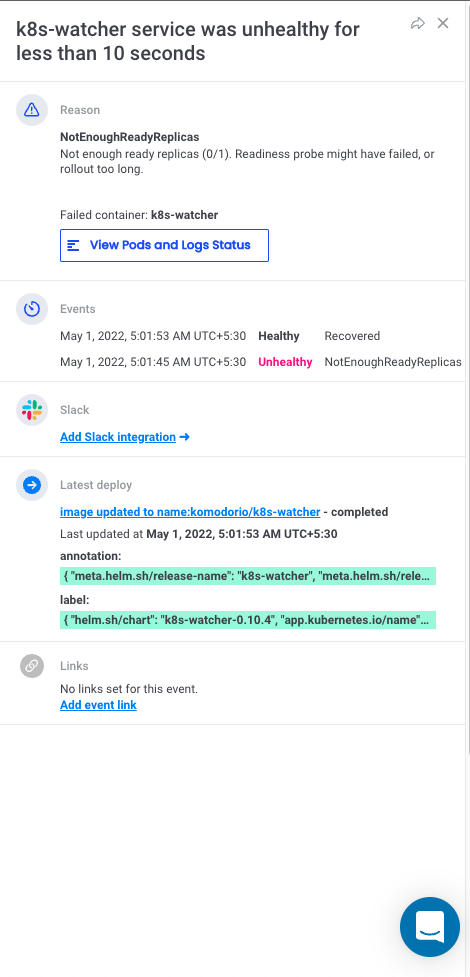
For instance, if you encounter an unhealthy service, this is what the event notification would look like:
The configuration files and all the other things are present in this repository
https://github.com/komodorio/helm-charts
7. Connect with Komodor
🖱 Github
🖱 Slack
8. References
🚩 https://komodor.com/
🚩 https://youtu.be/gqiyN4yP4Pc
🚩 https://docs.komodor.com/
🚩 https://youtu.be/iuXbgkaliNk
That's all for this blog, I hope you will learn something new. And feel free to share your thoughts and feedback, Thanks for reading.
Feel free to reach out me 👀
Twitter 🖱
LinkedIn 🖱
Github 🖱


